clear
set seed 42
set obs 500
gen id = _n
gen age = rnormal(50, 10)
expand 12
bysort id (age): gen time = _n - 1
gen bmi = .
bysort id (time): replace bmi = rnormal(25, 4) if time == 0
bysort id (time): replace bmi = bmi[_n-1] + rnormal(0, 1) if time > 0
gen treatment = .
bysort id (time): replace treatment = ///
    (runiform() < invlogit(-2 + 0.1 * (bmi - 25))) if time == 0
bysort id (time): replace treatment = ///
    cond(treatment[_n-1] == 0, ///
         runiform() < invlogit(-2 + 0.1 * (bmi - 25)), ///
         runiform() < 0.7) if time > 0
gen outcome = (runiform() < invlogit(-3 + 0.05 * (bmi - 25) - 0.4 * treatment))
bysort id (time): gen cumev = sum(outcome)
drop if cumev > 1
drop cumev
sort id timeSequential target trial emulation
Generate a synthetic person-period dataset; id individual identifier, time calendar period, treatment binary treatment indicator, outcome equal to 1 only in the period the event first occurs, age a baseline covariate, and bmi a time-varying confounder.
ITT estimator.
seqtte outcome, id(id) time(time) treatment(treatment) covariates(age)Original dataset: 5,745 observations, 6 variables
Eligible observations: 3,192 (500 individuals)
Expanding data...
Expanded dataset: 24,212 observations (person-trial periods)
Follow-up by treatment arm (arm 0 / arm 1):
Intervals (nonunique): 21,292 / 2,920
Individuals (unique): 421 / 367
Fitting ITT model...
Logistic regression Number of obs = 24,212
Wald chi2(6) = 8.24
Prob > chi2 = 0.2208
Log pseudolikelihood = -3429.2837 Pseudo R2 = 0.0051
(Std. err. adjusted for 500 clusters in id)
---------------------------------------------------------------------------------------
| Robust
event | Haz. ratio std. err. z P>|z| [95% conf. interval]
----------------------+----------------------------------------------------------------
event |
treatment | .9643634 .0949009 -0.37 0.712 .795199 1.169515
followup | .9712421 .0395387 -0.72 0.474 .8967587 1.051912
|
c.followup#c.followup | .9961455 .004202 -0.92 0.360 .9879437 1.004415
|
trial | .979687 .0332526 -0.60 0.545 .9166337 1.047078
|
c.trial#c.trial | .9934219 .0049925 -1.31 0.189 .9836848 1.003255
|
age | .9999884 .0075498 -0.00 0.999 .9853 1.014896
_cons | .0472244 .0188856 -7.63 0.000 .0215656 .103412
---------------------------------------------------------------------------------------
Note: _cons estimates baseline hazard.Unweighted PP estimator (censoring applied, no IPCW weights).
seqtte outcome, id(id) time(time) treatment(treatment) covariates(age) ///
    estimator(pp)
Original dataset: 5,745 observations, 6 variables
Eligible observations: 3,192 (500 individuals)
Expanding data...
Expanded dataset: 24,212 observations (person-trial periods)
Post-censoring dataset: 15,501 observations (non-censored person-trial periods)
Follow-up by treatment arm (arm 0 / arm 1):
Intervals (nonunique): 14,436 / 1,065
Individuals (unique): 421 / 367
Fitting PP model...
Logistic regression Number of obs = 15,501
Wald chi2(6) = 16.37
Prob > chi2 = 0.0119
Log pseudolikelihood = -2315.6322 Pseudo R2 = 0.0047
(Std. err. adjusted for 500 clusters in id)
---------------------------------------------------------------------------------------
| Robust
event | Haz. ratio std. err. z P>|z| [95% conf. interval]
----------------------+----------------------------------------------------------------
event |
treatment | .7139264 .1488 -1.62 0.106 .4745062 1.07415
followup | .9958307 .0364686 -0.11 0.909 .9268586 1.069935
|
c.followup#c.followup | .9941573 .0051025 -1.14 0.254 .9842068 1.004209
|
trial | 1.025551 .0375743 0.69 0.491 .9544888 1.101904
|
c.trial#c.trial | .9902408 .0051551 -1.88 0.060 .9801885 1.000396
|
age | .9938813 .0095183 -0.64 0.522 .9753998 1.012713
_cons | .0593804 .0289254 -5.80 0.000 .0228563 .1542696
---------------------------------------------------------------------------------------
Note: _cons estimates baseline hazard.PP estimator with unstabilized weights.
seqtte outcome, id(id) time(time) treatment(treatment) covariates(age) ///
    estimator(pp) wdenominator(age bmi)
Original dataset: 5,745 observations, 6 variables
Eligible observations: 3,192 (500 individuals)
Fitting weight models...
Weight models fitted
Expanding data...
Expanded dataset: 24,212 observations (person-trial periods)
Post-censoring dataset: 15,501 observations (non-censored person-trial periods)
Follow-up by treatment arm (arm 0 / arm 1):
Intervals (nonunique): 14,436 / 1,065
Individuals (unique): 421 / 367
Fitting PP model...
Logistic regression Number of obs = 15,501
Wald chi2(6) = 17.64
Prob > chi2 = 0.0072
Log pseudolikelihood = -3694.9192 Pseudo R2 = 0.0047
(Std. err. adjusted for 500 clusters in id)
---------------------------------------------------------------------------------------
| Robust
event | Haz. ratio std. err. z P>|z| [95% conf. interval]
----------------------+----------------------------------------------------------------
event |
treatment | .9742083 .2858064 -0.09 0.929 .5481914 1.731296
followup | 1.021024 .0563329 0.38 0.706 .9163742 1.137626
|
c.followup#c.followup | .9932345 .0077653 -0.87 0.385 .9781308 1.008572
|
trial | 1.093042 .0514368 1.89 0.059 .9967376 1.198652
|
c.trial#c.trial | .982949 .0060684 -2.79 0.005 .9711269 .994915
|
age | .9918234 .009965 -0.82 0.414 .9724833 1.011548
_cons | .0573528 .0299666 -5.47 0.000 .0205971 .1596997
---------------------------------------------------------------------------------------
Note: _cons estimates baseline hazard.PP estimator with stabilized weights. The numerator model contains the baseline covariate only; the denominator model additionally contains the time-varying confounder. (If the numerator and denominator models are given the same covariates the two models coincide, every weight is 1, and the fit is identical to the unweighted per-protocol analysis.)
seqtte outcome, id(id) time(time) treatment(treatment) covariates(age) ///
    estimator(pp) wdenominator(age bmi) wnumerator(age)
Original dataset: 5,745 observations, 6 variables
Eligible observations: 3,192 (500 individuals)
Fitting weight models...
Weight models fitted
Expanding data...
Expanded dataset: 24,212 observations (person-trial periods)
Post-censoring dataset: 15,501 observations (non-censored person-trial periods)
Follow-up by treatment arm (arm 0 / arm 1):
Intervals (nonunique): 14,436 / 1,065
Individuals (unique): 421 / 367
Fitting PP model...
Logistic regression Number of obs = 15,501
Wald chi2(6) = 14.53
Prob > chi2 = 0.0243
Log pseudolikelihood = -2412.6356 Pseudo R2 = 0.0049
(Std. err. adjusted for 500 clusters in id)
---------------------------------------------------------------------------------------
| Robust
event | Haz. ratio std. err. z P>|z| [95% conf. interval]
----------------------+----------------------------------------------------------------
event |
treatment | .7316589 .1520177 -1.50 0.133 .4869153 1.099421
followup | .9901457 .039389 -0.25 0.803 .9158777 1.070436
|
c.followup#c.followup | .994843 .0057526 -0.89 0.371 .9836317 1.006182
|
trial | 1.027465 .0360536 0.77 0.440 .9591765 1.100616
|
c.trial#c.trial | .9901955 .0049881 -1.96 0.050 .9804672 1.00002
|
age | .9918508 .0096454 -0.84 0.400 .9731251 1.010937
_cons | .0652447 .0319797 -5.57 0.000 .0249648 .1705149
---------------------------------------------------------------------------------------
Note: _cons estimates baseline hazard.Cumulative incidence curves for each treatment arm with the plot option.
seqtte outcome, id(id) time(time) treatment(treatment) covariates(age) plot
qui graph export ./img/seqtte-plot-01.svg, name(seqtte_cif) replace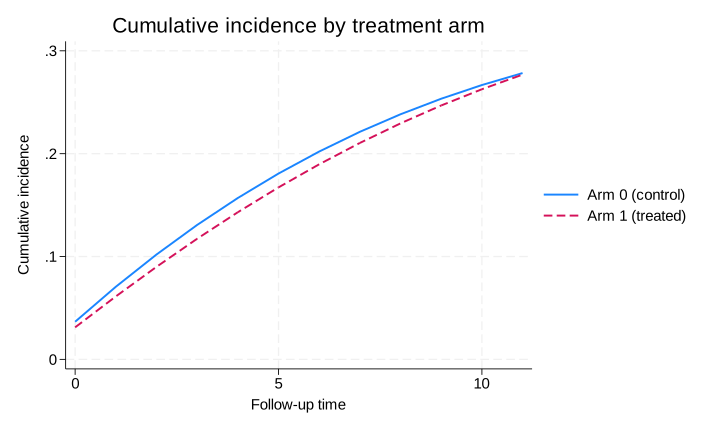
Bootstrap standard error and percentile confidence interval.
seqtte outcome, id(id) time(time) treatment(treatment) covariates(age) ///
    bootstrap(250) seed(12345)
Original dataset: 5,745 observations, 6 variables
Eligible observations: 3,192 (500 individuals)
Expanding data...
Expanded dataset: 24,212 observations (person-trial periods)
Follow-up by treatment arm (arm 0 / arm 1):
Intervals (nonunique): 21,292 / 2,920
Individuals (unique): 421 / 367
Running 250 bootstrap replicates...
Fitting ITT model...
Logistic regression Number of obs = 24,212
Wald chi2(6) = 8.24
Prob > chi2 = 0.2208
Log pseudolikelihood = -3429.2837 Pseudo R2 = 0.0051
(Std. err. adjusted for 500 clusters in id)
---------------------------------------------------------------------------------------
| Robust
event | Haz. ratio std. err. z P>|z| [95% conf. interval]
----------------------+----------------------------------------------------------------
event |
treatment | .9643634 .0949009 -0.37 0.712 .795199 1.169515
followup | .9712421 .0395387 -0.72 0.474 .8967587 1.051912
|
c.followup#c.followup | .9961455 .004202 -0.92 0.360 .9879437 1.004415
|
trial | .979687 .0332526 -0.60 0.545 .9166337 1.047078
|
c.trial#c.trial | .9934219 .0049925 -1.31 0.189 .9836848 1.003255
|
age | .9999884 .0075498 -0.00 0.999 .9853 1.014896
_cons | .0472244 .0188856 -7.63 0.000 .0215656 .103412
---------------------------------------------------------------------------------------
Note: _cons estimates baseline hazard.
Bootstrap complete: 250/250 replicates succeeded
Bootstrap SE (log-HR): 0.0974
Bootstrap 95% CI (log-HR): [-0.2357, 0.1408]
Estimated HR: 0.9644 with bootstrap 95% CI [0.7900, 1.1512]Perform the data expansion only, leaving the expanded dataset in memory for inspection or for fitting your own outcome model.
seqtte outcome, id(id) time(time) treatment(treatment) expandonlyOriginal dataset: 5,745 observations, 6 variables
Eligible observations: 3,192 (500 individuals)
Expanding data...
Expanded dataset: 24,212 observations (person-trial periods)
expandonly: returning expanded dataset ( 24,212 observations); analysis steps skippeddescribeContains data
Observations: 5,745
Variables: 6
---------------------------------------------------------------------------------------------------------------
Variable Storage Display Value
name type format label Variable label
---------------------------------------------------------------------------------------------------------------
id float %9.0g
age float %9.0g
time float %9.0g
bmi float %9.0g
treatment float %9.0g
outcome float %9.0g
---------------------------------------------------------------------------------------------------------------
Sorted by: id time
Note: Dataset has changed since last saved.